Key takeaways
- Observability means being able to see what an agent did, why it did it and what it cost, for every run.
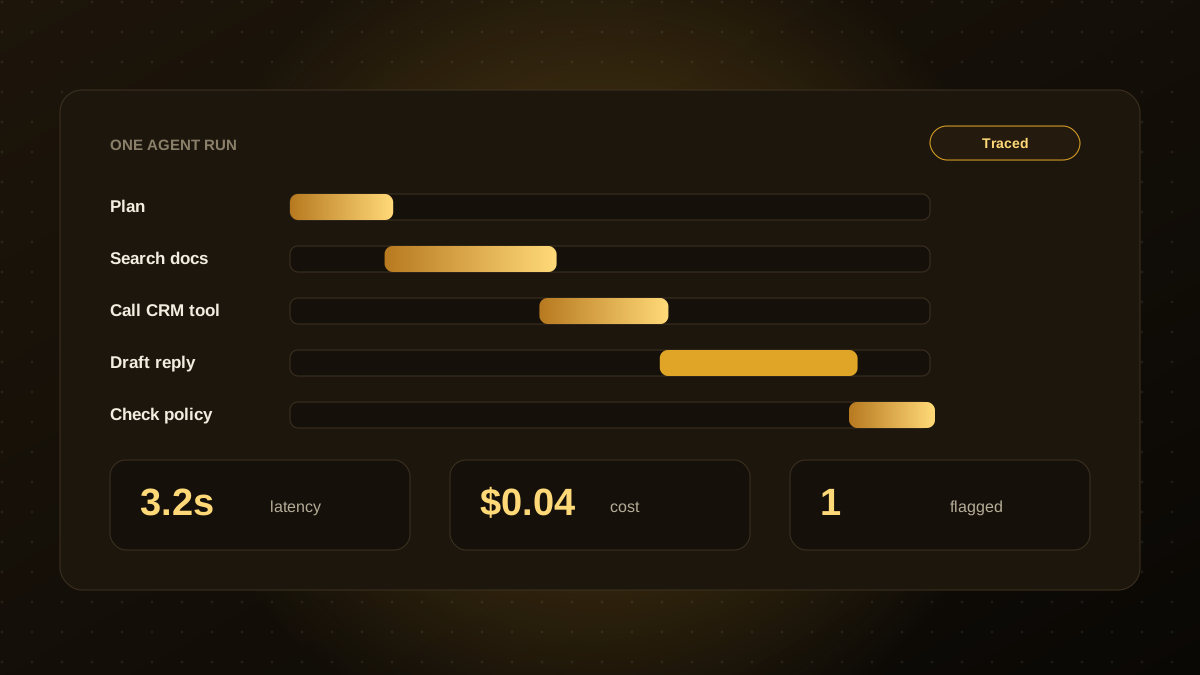
- Trace each run as a sequence of steps: model calls, tool calls, retrieved documents and decisions.
- Track quality, latency, cost and safety signals together, not just uptime.
- Alert on patterns such as loops, spend spikes, repeated tool errors and sudden refusals.
- Feed real failures back into your evaluation set so the same mistake does not return.
Why agents need more than ordinary monitoring
Traditional monitoring tells you whether a server is up. An AI agent can be perfectly healthy by those measures and still give wrong answers, call the wrong tool or quietly run up a large bill. Because agents make decisions at every step, you need to see those decisions, not only the system around them.
What to capture on every run
- The full trace. Each model call with its input and output, each tool call with parameters and results, and the order they happened in.
- The context. Which documents were retrieved and which memory was used, as covered in our guide to context engineering.
- Latency and cost per step and per run.
- Outcome signals. Did the task succeed, did a person correct it, did the user give feedback?
- Who and what. The user, the version of the prompt, the model and the tools involved.
Mask or avoid logging sensitive personal data, and set retention limits that match your privacy policy.
The four signals to watch
| Signal | Examples |
|---|---|
| Quality | Task success rate, user thumbs-down, escalation to a human, answers missing citations |
| Speed | Time to first response, steps per task, slow tools |
| Cost | Tokens and spend per run, per feature and per customer |
| Safety | Blocked actions, refusals, attempted prompt injection, access to sensitive tools |
Alerts that matter
- A run exceeds a step limit, which often means a loop.
- Spend per hour or per user jumps above its normal range.
- A tool starts failing repeatedly or returning unexpected data.
- Refusal or escalation rates change suddenly after a deployment.
- An action that should need approval is attempted without it.
Keep alerts few and actionable. Too many alerts get ignored.
Turn what you see into improvement
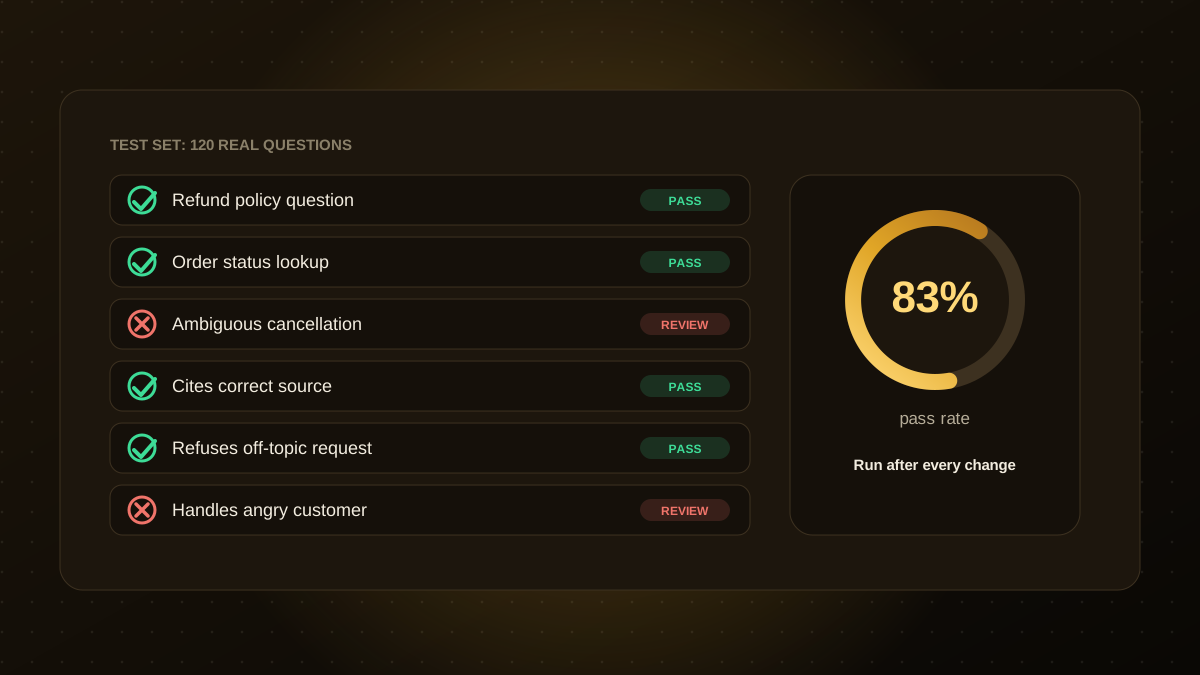
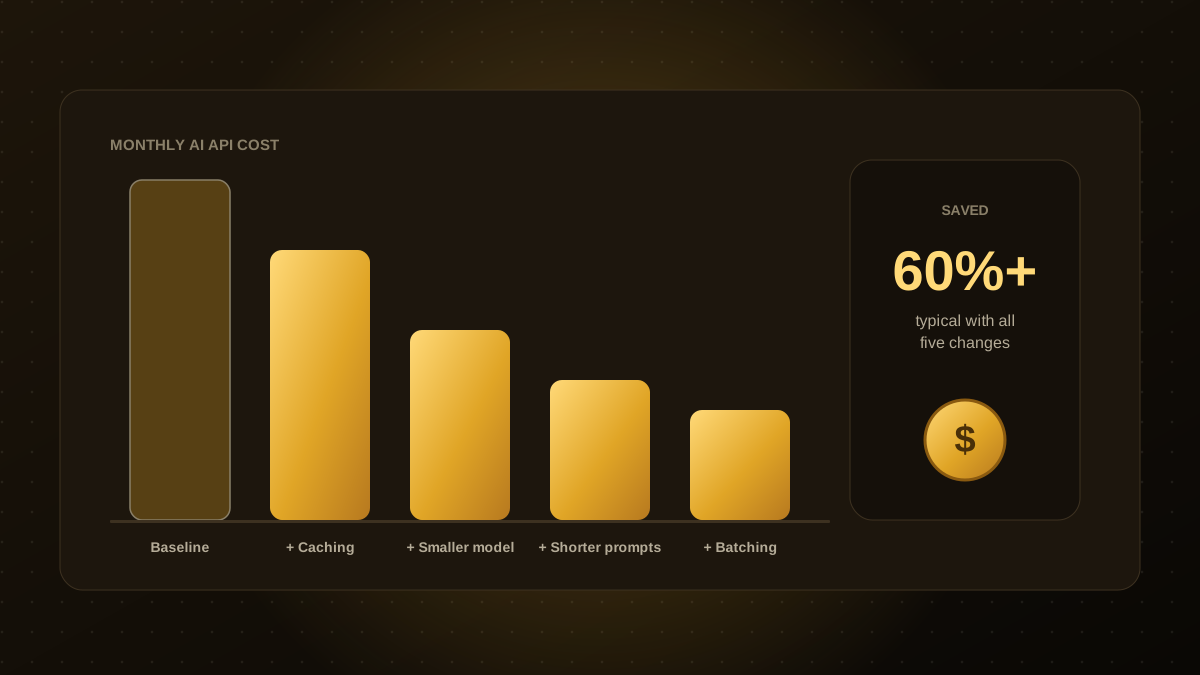
Review a sample of traces each week, especially failed and corrected runs. Each real failure should become a test case in your evaluation set. Use cost breakdowns to decide where a smaller model or caching would help, as described in our guide to reducing LLM API costs.
Tools and build choices
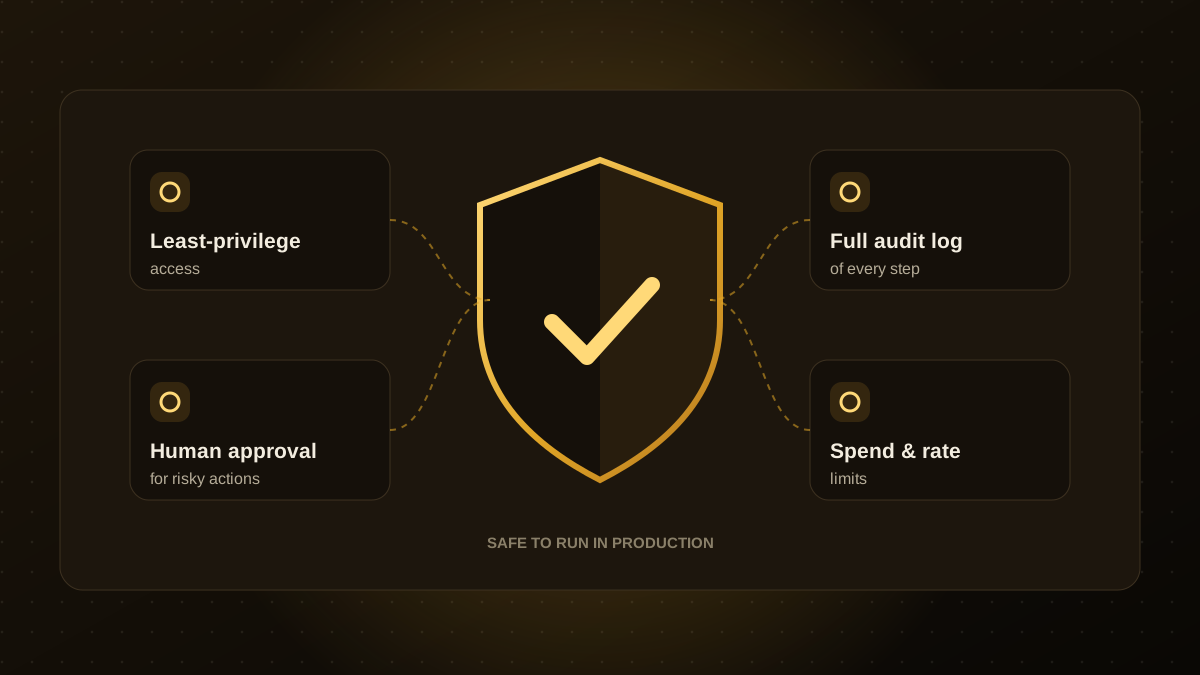
You can use dedicated LLM observability platforms, extend your existing logging and tracing stack, or combine both. What matters is that traces are searchable, tied to a user and version, and kept long enough to investigate incidents. Pair monitoring with the controls in our AI agent guardrails so that what you see can also be limited. If you want help adding observability to an agent you already run, our AI integration team can set it up.

Qodexify is a remote-first team of senior engineers building web apps, AI agents, workflow automation and websites. Learn more about our AI integration service or talk to an engineer.